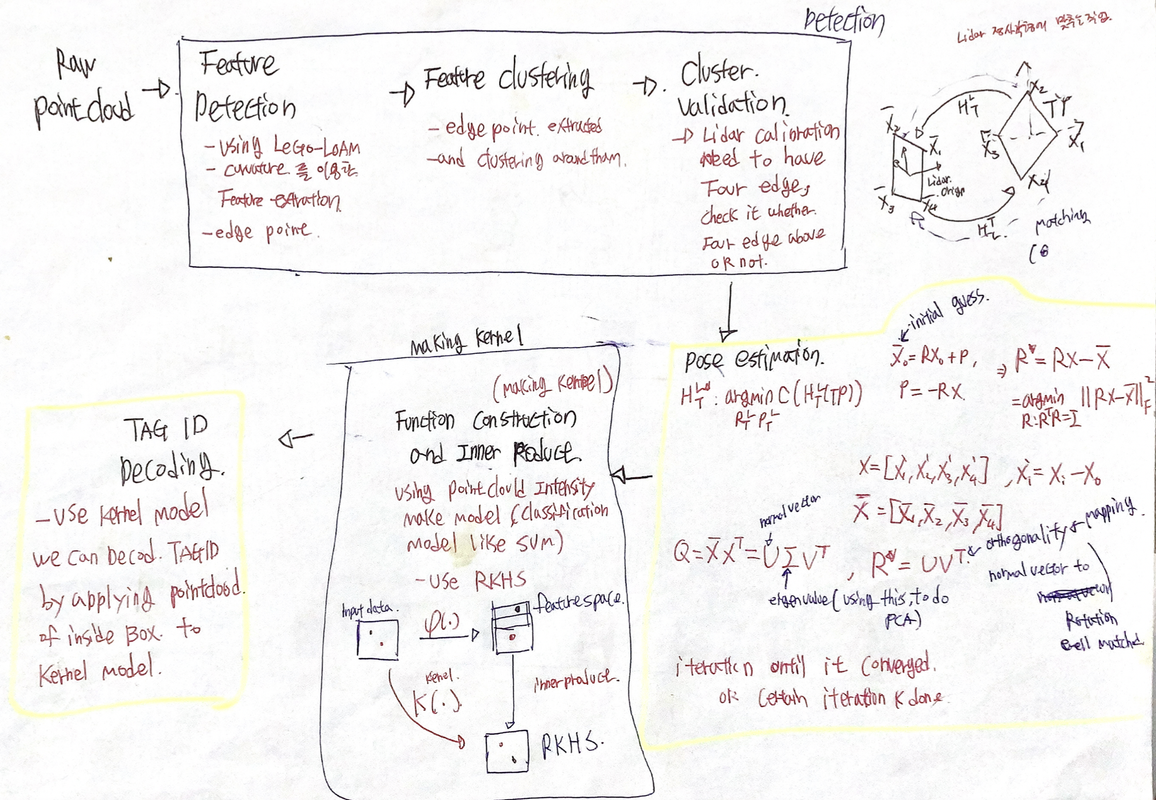
Hilbert space
힐베르트 스페이스는 거시세계 <-> 미시세계를 연결하는 역할을 한다.(Completeness)
여러 벡터(다차원의 데이터를) + - 로 계산하다 보면, 벡터 공간의 크기가 점점 커지기 때문에 문제가 될 수 있다.
이런 무한대로 커지는 벡터에 대한 크기를 방지하기 위해서 완비성(completeness)를 가진 hilbert space를 통해,
Function 과 Function간의 inner product를 통한 무한대의 벡터에 대해 수렴으로 관계를 정의할 수 있다.
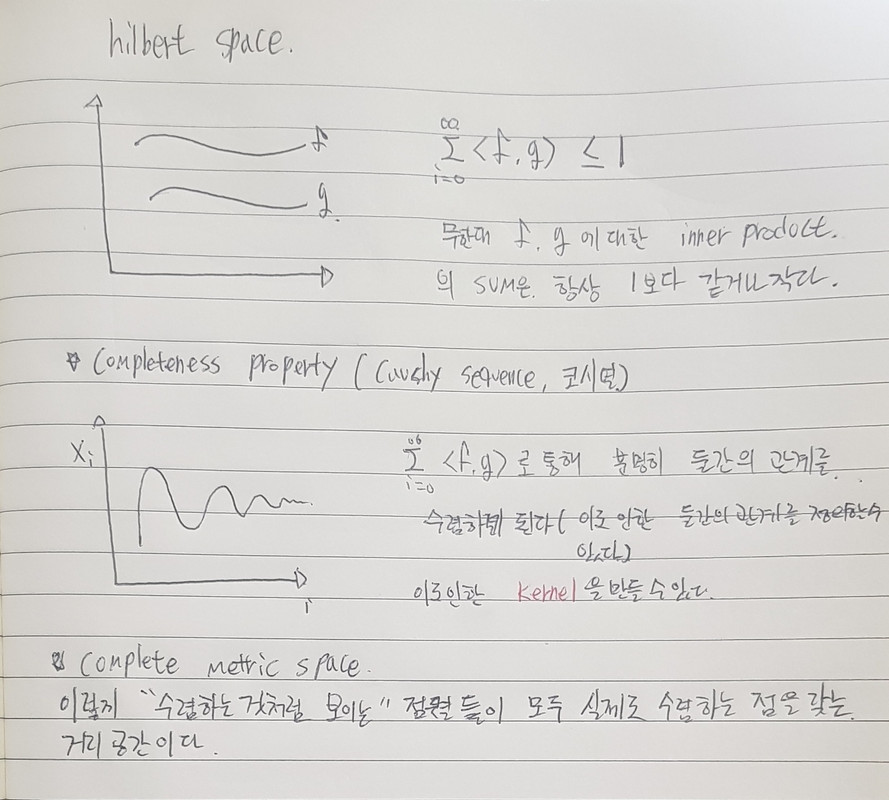
이는 이후 feature map의 inner product를 통한 데이터들의 상관 관계 decision plane을 만들 수 있다.
+)f,g 여기에 함수는 PFD처럼 여러 벡터들을 함수에 넣어서 벡터마다의 output을 뽑아내고 inner product을 통해 벡터간에 similarity를 구할 수 있다.
classification에서 많이 쓰인다.
Hilbert Space 참고
https://medium.com/@brcsomnath/hilbert-space-7a36e3badac2
https://ko.wikipedia.org/wiki/%EC%8B%A4%EC%88%98%EC%9D%98_%EC%99%84%EB%B9%84%EC%84%B1
https://ko.wikipedia.org/wiki/%EC%99%84%EB%B9%84%EA%B1%B0%EB%A6%AC%EA%B3%B5%EA%B0%84
Reproducing Kernal Hilbert space
줄인말로 RKHS 라고 하는데, 즉 우리는 2D or 3D 공간상에 labeling이 되어있는 데이터들간의 구분을 위해 hyperplane을 만들고 싶은데 아무래도 non linear하고 분배가 되어 있다보니, 이 문제를 해결하고나 RKHP를 통해 Kernal(Kernal trick)을 재생성하면서 Classification에 대한 문제를 풀 수 있다.(Kernal Methods라고 하며 Machine Learning에서 많이 쓰인다. 대표적으로 SVD)
hey translate data into a higher (often infinite) dimensional space, where it is far easier to separate data points than in their native space.
Statistical Methods – RKHS are used to perform approximations of difficult statistical calculations such as Independence, Conditional Independence, and Conditional Probability.
These are the applications that drew me to learn about them. The RKHS algorithms were always the most accurate, and had much better scaling properties with increasing data size and problem dimensionality.
The kernel of the RKHS determines what types of function are available in the space, as well as the meaning of the function’s result. Different kernels produce different types of functions, but some kernels are universal, meaning that they can emulate any continuous function to within isometric isomorphism, which is a fancy way of saying “exactly the same on the outside, though it may be different inside”.
Ket of RKHS is In any real-world scenario, we will quickly run out of data when we need to condition on many variables. RKHS solves this problem by returning a continuous function that represents the distribution, meaning that we effectively have an infinite number of data points to work with.
Implementing RKHS is embarrassingly easy. It may take hundreds of pages of math to describe RKHS, but only a few lines of code to make it work.
The code sample at the bottom implements a flexible, optimized RKHS in under 30 lines of Python code. A hard coded RKHS could probably be done in 10 lines. It bothers me that it took several weeks of intense study to understand an algorithm that took me an hour to implement.
discussed the kernel above, but not any function can be a kernel. The kernel requires some basic characteristics in order to be valid. It is a function that takes one or two values, and serves two distinct purposes:
When presented two arguments, it returns a distance in Hilbert Space between the two arguments, and when presented a single argument, it translates that argument into the Hilbert Space.
It is computed by taking an inner product of its parameter with the data provided to the RKHS.
My final topic in this primer is a very important feature of RKHS, and that is linearity of operations. The RKHS behaves in many ways like normal Euclidean space. This means that if we apply linear methods in RKHS, they change their meaning in a very important way.
A linear regression in RKHS is equivalent to a non-linear regression in a complex infinite dimensional space. So points that can’t be separated by a line (or hyperplane) in their native space can be easily separated by a linear regression in RKSH.
Similarly, if we compute function of variables in Euclidean space, such as Correlation(A,B), it tells us if the variables are linearly related. A Correlation of 0 indicates that the variables are linearly independent.
If I do the same calculation in RKHS, it tells me if the variables are Independent (i.e. non-linearly uncorrelated). The same is true with nearly any linear operation – in RKHS it becomes a non-linear operation. This is exemplified by the use of “kernel methods” in machine learning, though there are many other similar uses.
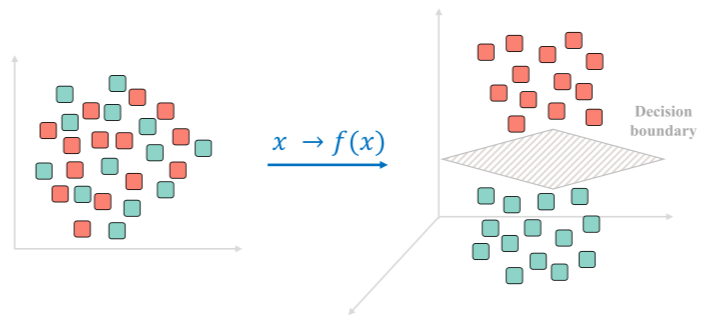
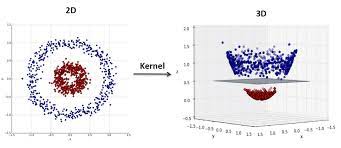
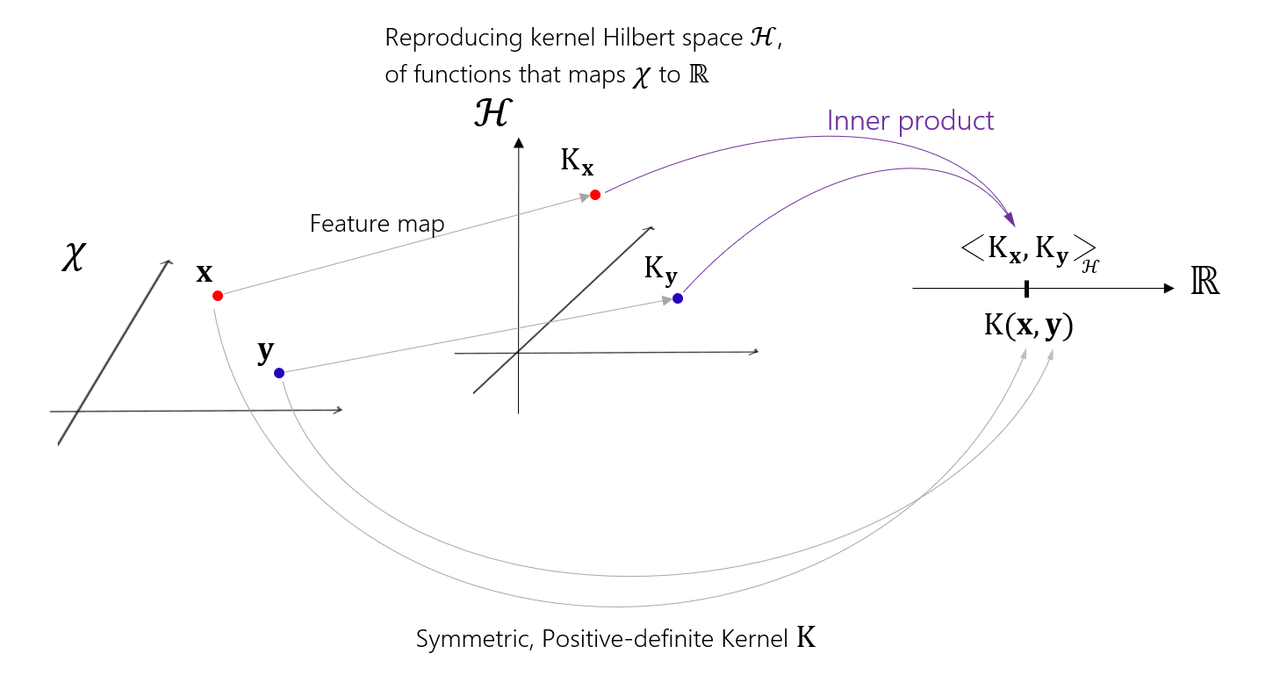
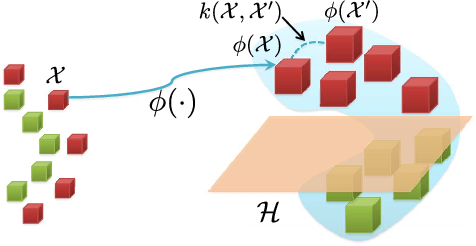
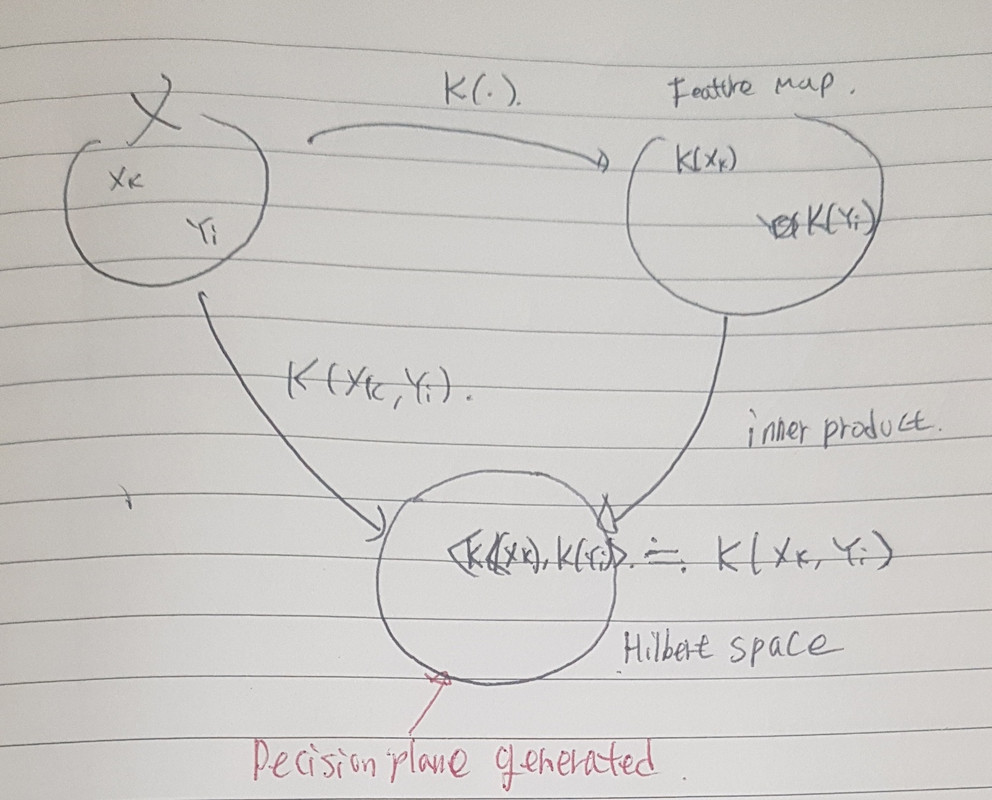
즉, feature map으로 만드는데 사용되는 function이 keneral(kernal = 특정 function, ex, PDF)이고 이를 통해서 무수히 많은 벡터들로 부터 kernal을 통한 output을 가지고, inner product을 통해 데이터간의 유사성을 판별할 수 있으며(0(orthgonal non related),1(related)), 구분할 수 있는 hyperplane(Decision plane)을 구할 수 있다. 이를 통해 kernal을 reproducing을 하여서 inner product의 값과 kenral output의 값을 같게 한다. 이를 통한 kernal을 통해 classification을 할 수 있다.
+) 만들어진 Decision plane에 데이터를 넣어서 쓰레쉬홀드를 활용한 데이터를 구분할 수 있는 모델을 만들 수도 있다.
+) 즉 inner product은 데이터간의 유사도를 확인할 때 많이 쓴다.
+) 또한 kernal을 통하여 데이터를 얻어지는데, 이를 classification으로 활용된다.
+) RKHS를 통해 다양한 데이터로 가공 할 수 있다. 예를 들어 PDF를 만든다고 할 때, 특정 데이터를 가지고 있는 벡터들과 upper, lower boundary를 가지고 있는 데이터들의 연속된 값을 Kernal을 통해 특정 데이터를 가지고 있는 벡터에 대한 PDF의 데이터 값을 만들 수있다.
+) feature map에서 inner product된 값과 kernal로 부터 아웃풋 나온 값이 같아야 한다.
엄청 설명 잘되어 있는 블로그!!
https://hpccsystems.com/blog/reproducing-RKHS
Applications
Signal Detection – RKHS are agile at separating signal from noise in communication settings.
Function Emulation – RKHS can perform the hat trick of converting a discrete set of measurements into a continuous function. This can be used, for example, to determine a Probability Density Function or a Cumulative Density Function associated with any sized data set.
Future Applications – RKHS are very flexible, and many other applications will surely be discovered.
Rproducing kernal Hilbert space 참고
https://en.wikipedia.org/wiki/Reproducing_kernel_Hilbert_space
http://songcy.net/posts/story-of-basis-and-kernel-part-1/


