Integral Image를 사용한 Normal Surface 구하기
23 Oct 2021 | Machine Vision
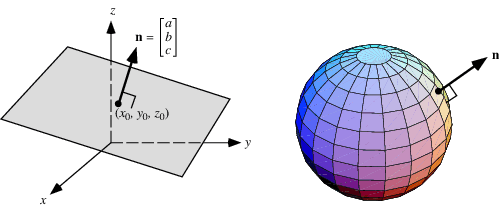
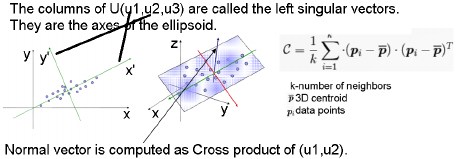
Plane Segementation을 하는데 있어 많이 사용하는 방법이 Integral Image 방법을 통해서 Window Traversal을 통한 윈도우 사이즈 별로 2D Pixel 형태로 된 Intergral image의 center point(mean)와 standard deviation을 통해서 Covariance Matrix를 구하고 PCA를 통해 eigen vector와 eigen value를 얻어 Normal Surface의 법선 벡터를 구하는 방법이다.(eigenvalue가 작은 쪽이 방향을 나타내는 법선 벡터가 된다.)
예를 들어 몇 만개의 포인트 클라우드가 있다고 가정을 할때 Ground Segementation을 Integral Image를 이용한 해보겠다,
- 포인트 수만큼에 2D 행렬(500x500)을 만든다.(만약 뎁스이미지 카메라라면, 이미지 크기만큼 만든다)
- 포인트 순서대로 pixel address에 삽입을 한다.(xyz 포인트 픽셀 address에 삽입)
- integral image를 만든다.(first order)
- 각 xyz포인트의 제곱을 하여서 매트릭스 데이터를 구하고 integral image를 만든다.(second order) (3x1 * 1x3) = 3x3 <- Covariance Matrix
- normal surface를 구하기 위해 특정 window traversal 할 surface 크기(window size)를 설정해준다. (예 with, height : 2x2)
- 윈도우 사이즈 만큼, intergral image 영역을 돌면서 first order의 sum값에 window size안에 있는 요소 숫자만큼 나눠줘서 Central(point xyz(mean)) 값을 구한다
- 윈도우 사이즈 만큼, second integral 영업을 돌면서 second order의 sum값에 window size안에 있는 요소 숫자(or central points)만큼 나눠서 Covaraince Matrix값을 얻는다.
- 얻어진 covariance Matrix에 PCA를 통해 eigen vector와 eigen value를 얻고, Normal Surface에서의 Normal Vector(방향) 값을 얻게 된다.(2개의 벡터가 크거나 같고, 하나가 작다면 Plane, eigenvalue 작은것에 해당하는 것이 normal vector, 2개가 작고 하나가 크다면 line, 3개 모두 작다면 point로 구분할 수 있다.)
- 이렇게 된다면 2x2 사이즈의 Normal Surface를 얻게 됨으로 500x500에서, 250x250 수만큼 줄어들게 된다.
- 얻어진 eigenvalue를 통해 Normal Surface에 대한 shape를 구하고, curvature를 구하여서 너무 휜 현상을 제거하게 한다.
- 각 normal surface의 plane coefficiene를 구하여 Ransac을 통해 Object와 plane을 구분하게 된다.
다른 방법 보다 속도가 빠르기 떄문에 많이들 사용한다.
feature extaction(haar-like) using Integral Image
So remember that Haar-like features are a series of frames that “pan” over an array that represents a grayscale image. These frames can be scaled to nearly any size except a 1x1 pixel. This is because each cell (or element) of the frame (and the image array) represents a single pixel, which can only contain the value for a single color.
// use for integra image is to seperate the feature things(ex, neightboring pixel are whiteness or blackness.) with specific paatern(can be like window size.).
what is integral image
- it’s an array whose values are the sums of values of an image.
- look at the example “https://levelup.gitconnected.com/the-integral-image-4df3df5dce35”
- The value for the cell in our integral image is the sum of all the numbers in the shaded area.
- A cell in the Integral image corresponds to a specific area in the original image. The value of that cell is the sum of all the values in that corresponding area in the original image.
- This is where the Integral image shines. Because each cell of the Integral image corresponds to an area of the original image, we can find the sum of the area that holds all of the values we have outlined and then subtract the excess values. L


