12. predict avocado price
12 Sep 2019 | Python
PROBLEM STATEMENT
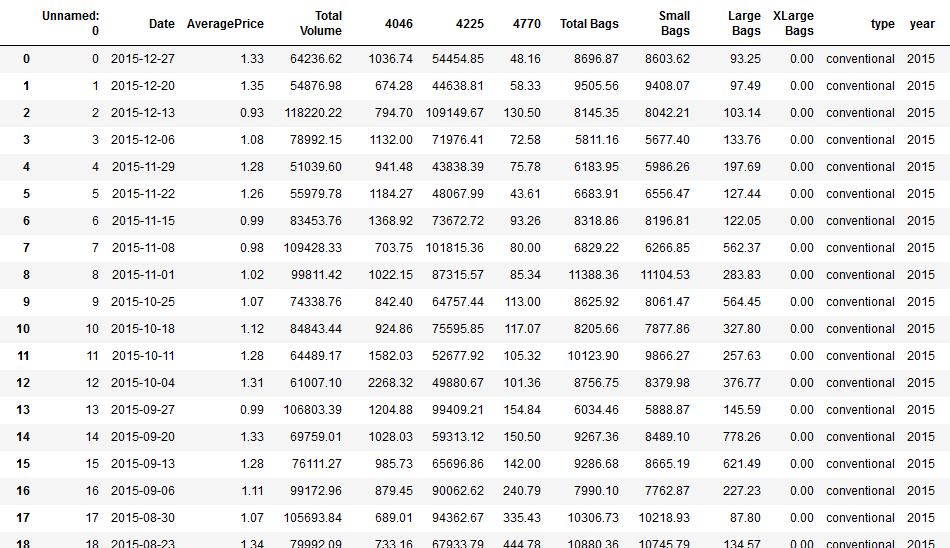
- Data represents weekly 2018 retail scan data for National retail volume (units) and price.
- Retail scan data comes directly from retailers’ cash registers based on actual retail sales of Hass avocados.
- Starting in 2013, the table below reflects an expanded, multi-outlet retail data set. Multi-outlet reporting includes an aggregation of the following channels: grocery, mass, club, drug, dollar and military.
- The Average Price (of avocados) in the table reflects a per unit (per avocado) cost, even when multiple units (avocados) are sold in bags.
- The Product Lookup codes (PLU’s) in the table are only for Hass avocados. Other varieties of avocados (e.g. greenskins) are not included in this table.
- Some relevant columns in the dataset:
- Date - The date of the observation
- AveragePrice - the average price of a single avocado
- type - conventional or organic
- year - the year
- Region - the city or region of the observation
- Total Volume - Total number of avocados sold
- 4046 - Total number of avocados with PLU 4046 sold
- 4225 - Total number of avocados with PLU 4225 sold
- 4770 - Total number of avocados with PLU 4770 sold
Importing Data
- You must install fbprophet package as follows: pip install fbprophet
- If you encounter an error, try: conda install -c conda-forge fbprophet
- Prophet is open source software released by Facebook’s Core Data Science team.
- Prophet is a procedure for forecasting time series data based on an additive model where non-linear trends are fit with yearly, weekly, and daily seasonality, plus holiday effects.
- Prophet works best with time series that have strong seasonal effects and several seasons of historical data.
- For more information, please check this out: https://research.fb.com/prophet-forecasting-at-scale/ https://facebook.github.io/prophet/docs/quick_start.html#python-api
# import libraries
import pandas as pd # Import Pandas for data manipulation using dataframes
import numpy as np # Import Numpy for data statistical analysis
import matplotlib.pyplot as plt # Import matplotlib for data visualisation
import random
import seaborn as sns
from fbprophet import Prophet
# the class for prophet of big data
# made from facebook's team
# dataframes creation for both training and testing datasets
avocado_df = pd.read_csv('avocado.csv')
# Let's view the head of the training dataset
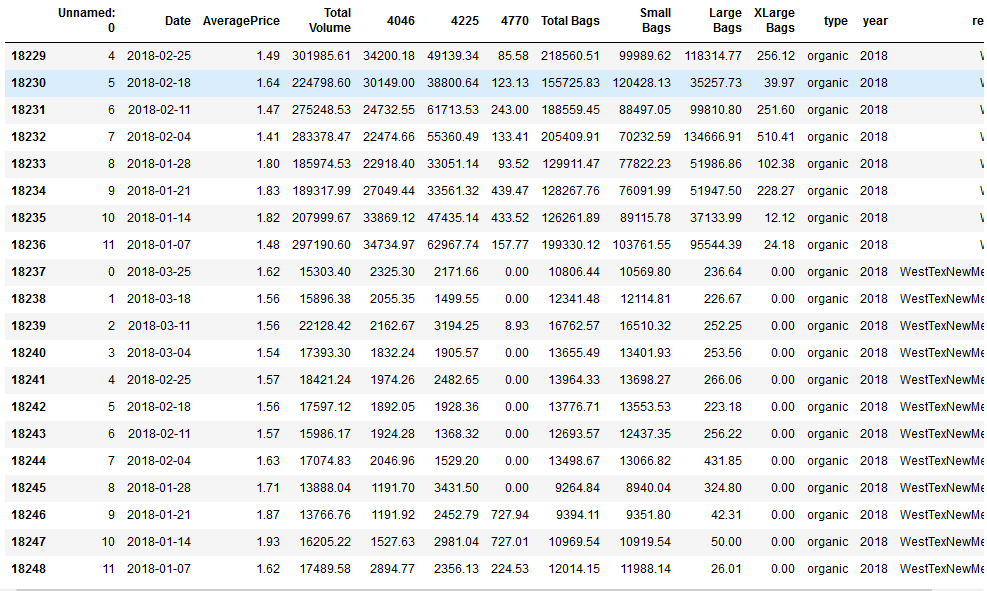
avocado_df.head()
# Let's view the last elements in the training dataset
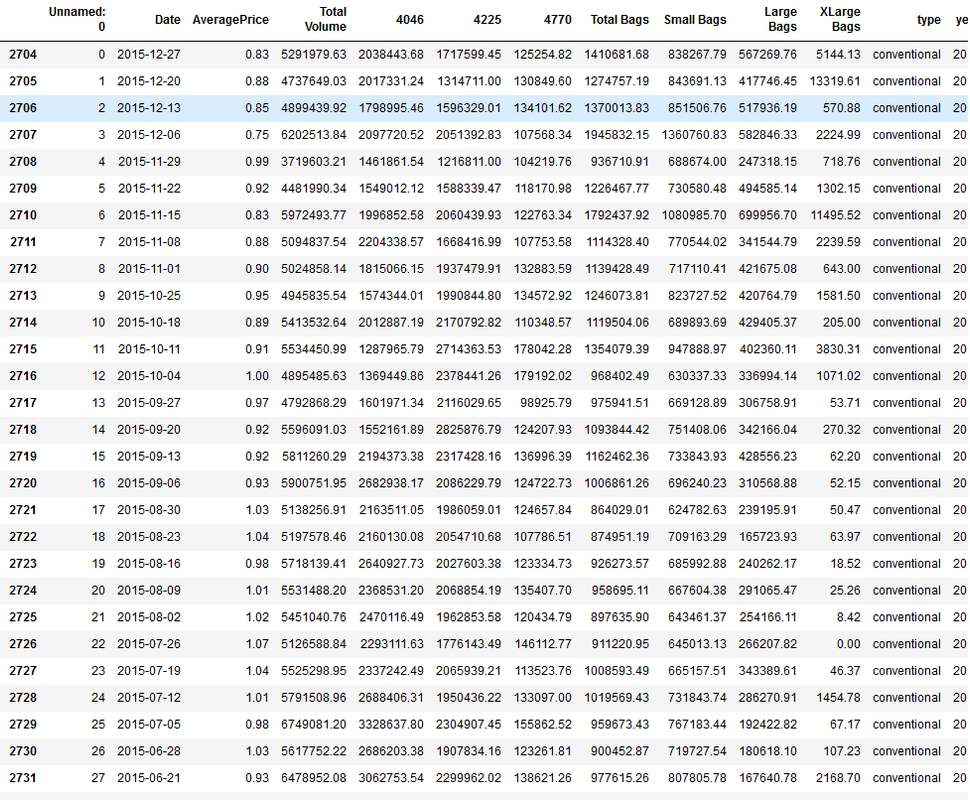
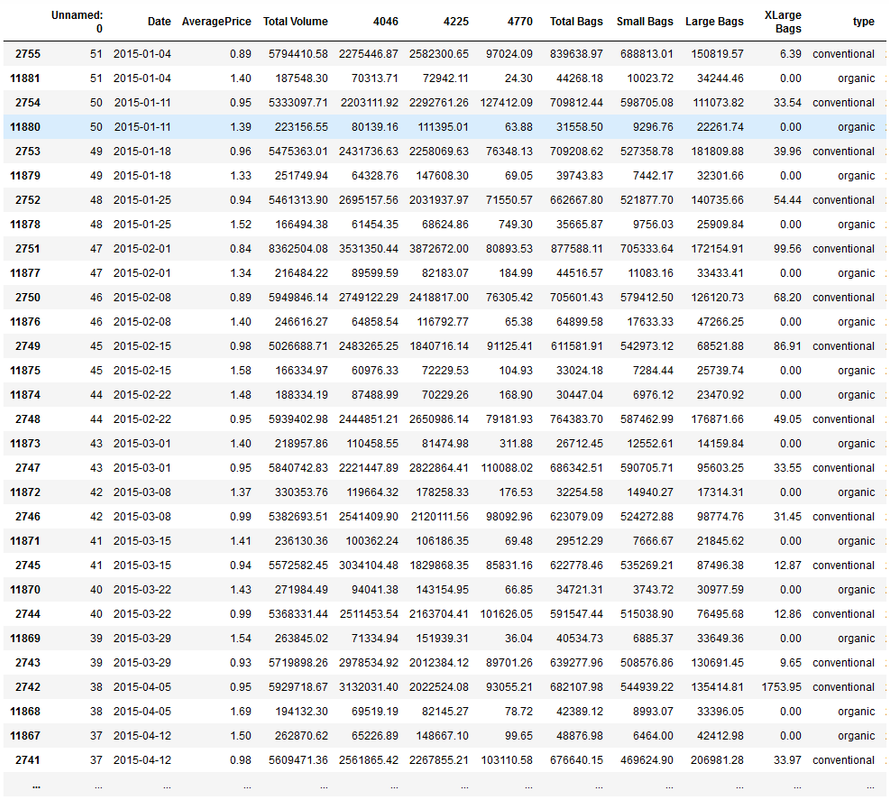
avocado_df.tail(20)
avocado_df = avocado_df.sort_values("Date")
# we sort data thuugh date (sort_values)
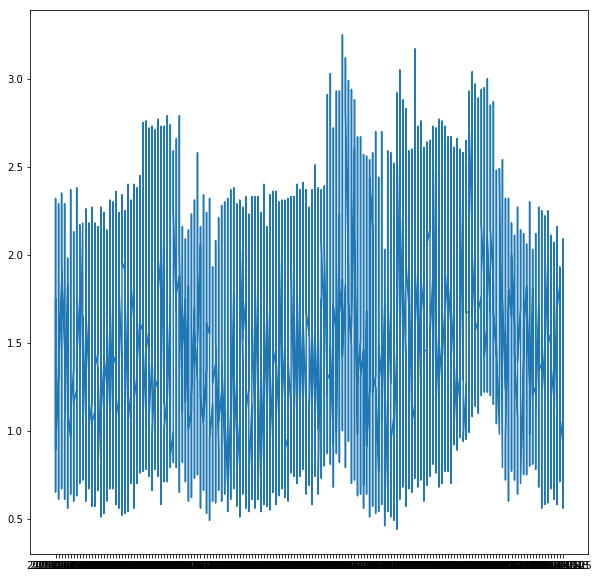
plt.figure(figsize=(10,10))
plt.plot(avocado_df['Date'], avocado_df['AveragePrice'])
# Bar Chart to indicate the number of regions
plt.figure(figsize=[25,12])
sns.countplot(x = 'region', data = avocado_df)
# useualy sns class (x, data)
plt.xticks(rotation = 45)
(array([ 0,  1,  2,  3,  4,  5,  6,  7,  8,  9, 10, 11, 12, 13, 14, 15, 16,
        17, 18, 19, 20, 21, 22, 23, 24, 25, 26, 27, 28, 29, 30, 31, 32, 33,
        34, 35, 36, 37, 38, 39, 40, 41, 42, 43, 44, 45, 46, 47, 48, 49, 50,
        51, 52, 53]), <a list of 54 Text xticklabel objects>)
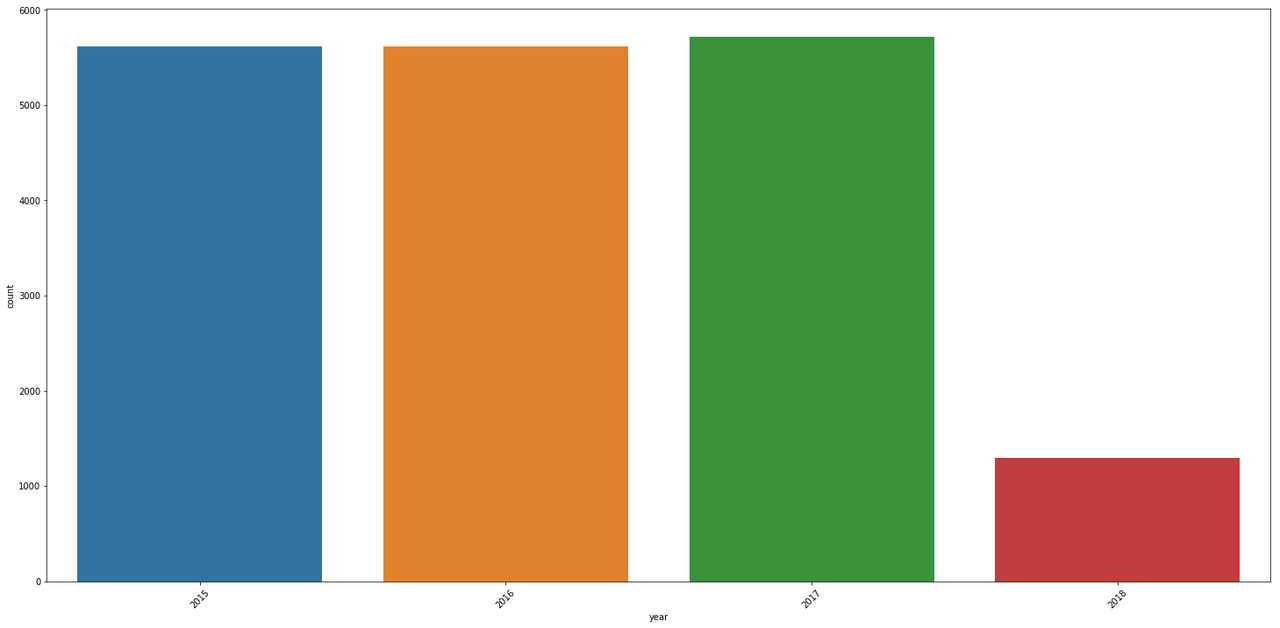
# Bar Chart to indicate the year
plt.figure(figsize=[25,12])
sns.countplot(x = 'year', data = avocado_df)
plt.xticks(rotation = 45)
#plit.xticks is that set locations and label
# (array([0, 1, 2, 3]), <a list of 4 Text xticklabel objects>)
avocado_prophet_df = avocado_df[['Date', 'AveragePrice']]
# what we want to prophet though data and averageprice in future.
# so all we need is ‘DATE' and 'AveragePrice'
avocado_prophet_df
          Date 	AveragePrice
11569 	2015-01-04 	1.75
9593 	2015-01-04 	1.49
10009 	2015-01-04 	1.68
1819 	2015-01-04 	1.52
9333 	2015-01-04 	1.64
2807 	2015-01-04 	0.75
1195 	2015-01-04 	0.85
10269 	2015-01-04 	1.50
103 	2015-01-04 	1.00
1143 	2015-01-04 	0.80
623 	2015-01-04 	0.74
10425 	2015-01-04 	1.82
1871 	2015-01-04 	1.01
11673 	2015-01-04 	1.80
10945 	2015-01-04 	1.81
2547 	2015-01-04 	1.15
11725 	2015-01-04 	1.72
10477 	2015-01-04 	1.56
2131 	2015-01-04 	1.05
Make Predictions
avocado_prophet_df = avocado_prophet_df.rename(columns={'Date':'ds', 'AveragePrice':'y'})
# rename the 'key' names
#in order fro prophet to do quickly.
avocado_prophet_df
            ds 	    y
11569 	2015-01-04 	1.75
9593 	2015-01-04 	1.49
10009 	2015-01-04 	1.68
1819 	2015-01-04 	1.52
9333 	2015-01-04 	1.64
2807 	2015-01-04 	0.75
1195 	2015-01-04 	0.85
10269 	2015-01-04 	1.50
103 	2015-01-04 	1.00
1143 	2015-01-04 	0.80
623 	2015-01-04 	0.74
10425 	2015-01-04 	1.82
1871 	2015-01-04 	1.01
11673 	2015-01-04 	1.80
10945 	2015-01-04 	1.81
2547 	2015-01-04 	1.15
11725 	2015-01-04 	1.72
10477 	2015-01-04 	1.56
2131 	2015-01-04 	1.05
259 	2015-01-04 	1.02
415 	2015-01-04 	1.19
2495 	2015-01-04 	1.00
9177 	2015-01-04 	1.79
10113 	2015-01-04 	1.22
2339 	2015-01-04 	1.01
2235 	2015-01-04 	0.99
2703 	2015-01-04 	0.95
1975 	2015-01-04 	1.20
9437 	2015-01-04 	1.73
1611 	2015-01-04 	1.05
... 	... 	...
m = Prophet()
m.fit(avocado_prophet_df)
# pass along our data frame
#how can we train the model.
# we're just trying to train the kind of a model to try to predict the future in a way
# Forcasting into the future
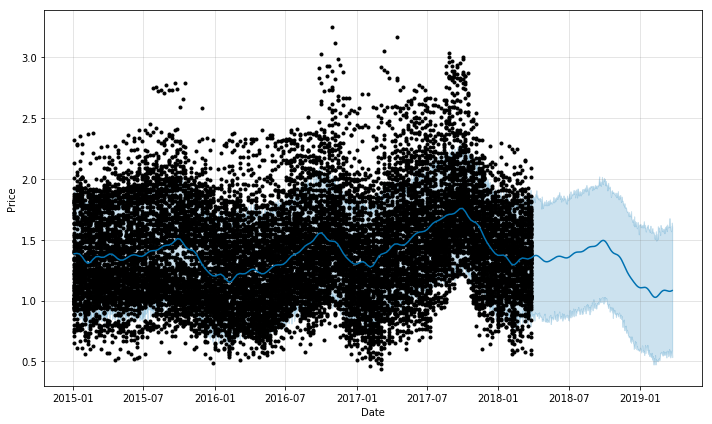
future = m.make_future_dataframe(periods=365)
# make prediction future.
#"365" predict one year
forecast = m.predict(future)
forecast
figure = m.plot(forecast, xlabel='Date', ylabel='Price')
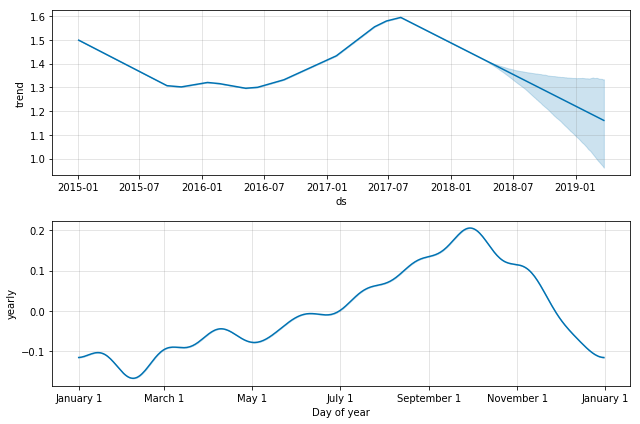
figure3 = m.plot_components(forecast)
PART 2
# dataframes creation for both training and testing datasets
avocado_df = pd.read_csv('avocado.csv')
# select specific region
avocado_df
avocado_df_sample = avocado_df[avocado_df['region']=='West']
# take a specific region
avocado_df_sample
avocado_df_sample = avocado_df_sample.sort_values("Date")
avocado_df_sample
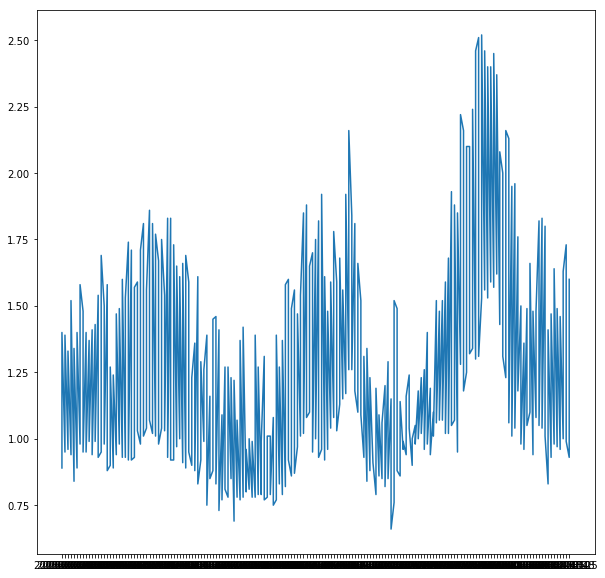
plt.figure(figsize=(10,10))
plt.plot(avocado_df_sample['Date'], avocado_df_sample['AveragePrice'])
avocado_df_sample = avocado_df_sample.rename(columns={'Date':'ds', 'AveragePrice':'y'})
m = Prophet()
m.fit(avocado_df_sample)
# Forcasting into the future
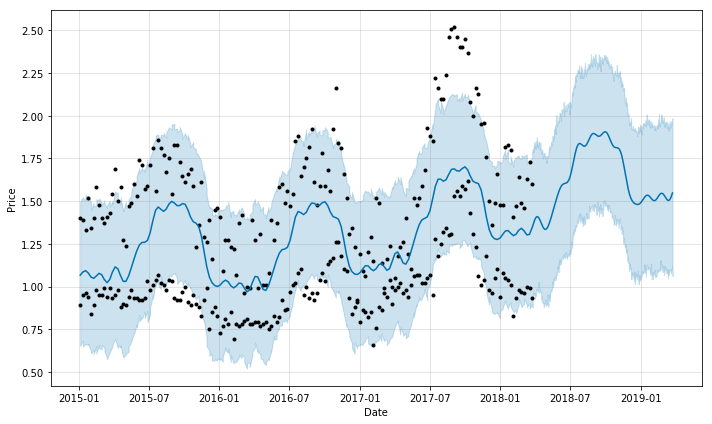
future = m.make_future_dataframe(periods=365)
forecast = m.predict(future)
figure = m.plot(forecast, xlabel='Date', ylabel='Price')
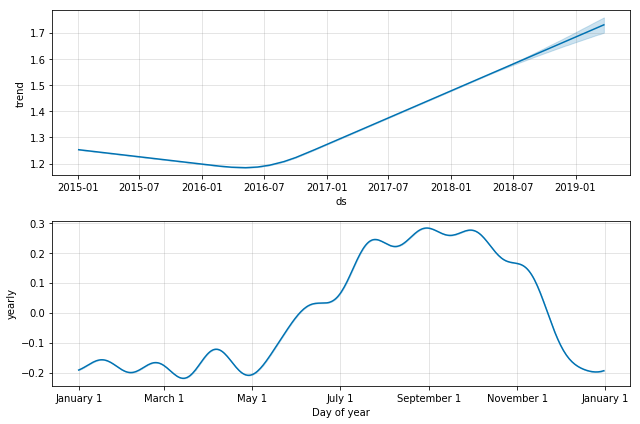
figure3 = m.plot_components(forecast)




Comments