Factor Graph
08 Apr 2021 | SLAM
Grahp SLAM이나 Pose Graph optimization, Bundle Adjustment 에 많이 사용함
-
For example, in simultaneous localization and mapping (SLAM) and many other estimation problems we are after a maximum a posteriori estimate, i.e., we try to maximize posterior probability of the variables given a set of measurements.
-
When attempting to act optimally, we try to maximize a performance index, or conversely minimize a penalty function. And even in classical planning, we are trying to find an assignment to a set of discrete variables that minimizes the plan length or optimizes for some other desirable property of the plan.
-
For example, in a tracking application, a particular video frame only provides information about the position of a target at a particular time. At the next time step, a different variable is associated with the target. Of course, this depends on the parametrization chosen: if a track is globally parametrized, for example as a polynomial, this locality is destroyed.
-
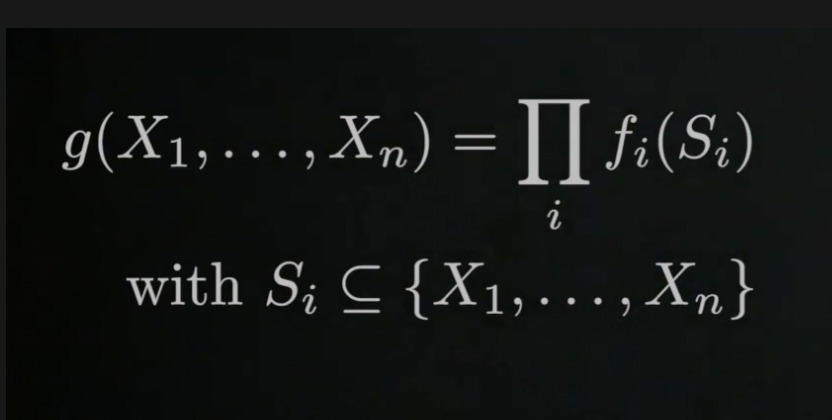
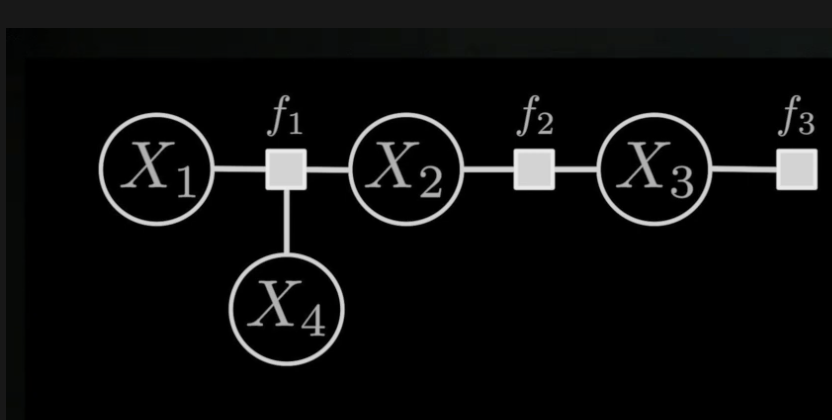
Factor graphs are a class of graphical models in which there are variables and factors. The variables represent unknown quantities in the problem, and the factors represent functions on subsets of the variables. Edges in the factor graph are always between factors and variables, and indicate that a particular factor depends on a particular variable.
- 간단한 식은 위에와 같다. 모든 relative variable들을 곱한것.
Factor Graph를 쓰면 probability distrubution이 간단해 진다.
위에 예와 같이 엣지는 노드(로봇의 포즈 상태)간의 상관성(예를 들어 : Odometery, 예측값)이고, 만약 관측값이 있다면, Least square 방법을 통해서
e(x-x^) M e(x-x^)^t 와 같이
(관측값 - 예측값) x information Matrix(covariance matrix) x (콴측값- 예측값)^t 을 통해 에러를 최적화 시킨다.
Object Function 안에 있는 것을 Factor 라고 하는구만!
VIO factor,
GPS factor
Semantic Factor
IMU Factor
etc,


Comments