for Robot Artificial Inteligence

5. Nonstationary bandit

|

Nonstationary Bandits

  • there equations will show up again and again
  • what is stationary?
  • A stationary process is one whose statistics don’t change over rime(e.g mean)
  • weak-sense stationary: mean(1st order statistic) and autocovariance(2nd order statistic) don’t change overtime
    • if don’t know covariance let’s check it in here
  • strong-sense stationary: entire PDF doesn’t change over time
  • SSS -> WSS
  • what if our bandits are not stationary? does it make sense to calculate the mean as we have been?

    Mean Update Equation

  • from earlier:
  • some rearranging for convenience:
  • Replace 1/t:
  • Alpha can be anything(even constant). looks kind of like gradient descent
  • One adaptive learning rate used 1/t

Low pass filter

  • should look familiar:
  • Low-pass filter studied in ML related to RNN(i will post ML too in future)
  • Get rid of recurrence(复发):
  • Q has exponentially decaying dependence on X
  • More emphasis on recent value

Convergence Criteria for Q

  • Q will converge if :
  • think back to calculus 2(두번쨰)
  • constant alpha does not converge
  • 1/t does
  • if problem is Nonstationary, we don’t want Convergence(融合)(equal weighting of all samples doesn’t make sense) so we will see constant alpha used
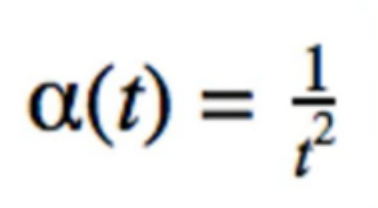
  • Does this converge?
  • No. Sum of alphas is not infinity
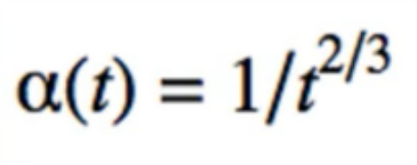
  • Does this convergence?
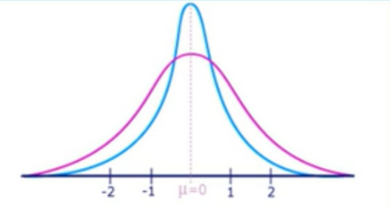
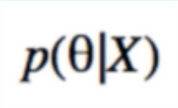
  • Nonstationary system은 모델 파라미터 Θ가 시간의 변화에 따라서 상수가 변한다. 광고를 예시를 들면, 광고에 대한 방문자의 선호도는 제품에 대한 소문, 잦은 광고, 노출에 따른 여러가지 이유로 변할 수 있기 때문이다. 이러한 환경의 MAB문제를 Non-stationary 문제라고 한다. 시간에 흐름에 따라 α+β값이 증가함으로 Θ에 대한 추정이 어려워진다.
# From the course: Bayesin Machine Learning in Python: A/B Testing
# https://deeplearningcourses.com/c/bayesian-machine-learning-in-python-ab-testing
# https://www.udemy.com/bayesian-machine-learning-in-python-ab-testing
from __future__ import print_function, division
from builtins import range
# Note: you may need to update your version of future
# sudo pip install -U future


import matplotlib.pyplot as plt
import numpy as np
from bayesian_bandit import Bandit


def run_experiment(p1, p2, p3, N):
  bandits = [Bandit(p1), Bandit(p2), Bandit(p3)]

  data = np.empty(N)

  for i in range(N):
    # thompson sampling
    j = np.argmax([b.sample() for b in bandits])
    x = bandits[j].pull()
    bandits[j].update(x)

    # for the plot
    data[i] = x
  cumulative_average_ctr = np.cumsum(data) / (np.arange(N) + 1)

  # plot moving average ctr
  plt.plot(cumulative_average_ctr)
  plt.plot(np.ones(N)*p1)
  plt.plot(np.ones(N)*p2)
  plt.plot(np.ones(N)*p3)
  plt.ylim((0,1))
  plt.xscale('log')
  plt.show()


run_experiment(0.2, 0.25, 0.3, 100000)

Reference:

Artificial Intelligence Reinforcement Learning

Advance AI : Deep-Reinforcement Learning

Cutting-Edge Deep-Reinforcement Learning

Comment  Read more

22. Fstream(2)

|

Comparing content of two files

read 함수

basic_istream& read(char_type* s, std::streamsize count);
  • istream::read(istream에서 정의 됨)
  • 스트림에서 문자들을 받아온다.
  • 이 함수는 sentry (警卫)객체를 먼저 생성한 후, 이를 확인한 다음에 s 가 가리키는 공간에 문자들을 읽어와서 저장합니다. 이 떄 아래 조건을 만족할 때 까지 문자들을 계속 읽어들이게 됩니다.
    • count 개의 문자들을 읽었을 때
    • EOF 가 발생하였을 때 (이 경우 setstate(failbit eofbit) 이 호출되었을 것입니다.) 읽어들인 문자의 수는 gcount() 함수를 호출함으로써 알아낼 수 있습니다.
  • 인자들
    • s - 읽어들인 문자들을 저장할 문자 배열
    • count - 문자 몇 개를 읽을 것인지.
  • 리턴값
    • (asterisk)this

Example 1

#include <iostream>
#include <fstream>
#include "string.h"
//ios::ate - At The End - sets pointer at the end of file - the place of pointer can be changed in that mode, it's possible to read and write in that mode
using namespace std;

bool areFilesEqual(fstream *, fstream *); // fstream doesn't have copy constructor, so we use pointer
int sizeOfFile(fstream *);
int main()
{
    /*
        read(where to read, how many bytes to read);
        memcmp it stands memory compare
    */

    fstream file1, file2;

    file1.open("sample.txt", ios::in | ios::binary | ios::ate);
    file2.open("sample2.txt", ios::in | ios::binary | ios::ate);

    if (file1.is_open() && file2.is_open())
    {
        if (areFilesEqual(&file1, &file2))
        {
            cout << "Files are equal";
        }
        else
            cout << "Files are not the same" << endl;

    }
    else
        cout << "The file couldn't be opened properly" << endl;

    return 0;
}
bool areFilesEqual(fstream *a, fstream *b)
{
    int fileSize1 = sizeOfFile(a);
    int fileSize2 = sizeOfFile(b);

    if (fileSize1 == fileSize2)
    {
        int BUFFER_SIZE;

        if(fileSize1 > 1024)
            BUFFER_SIZE = 1024;
        else
            BUFFER_SIZE = fileSize1;

        char *file1buffer = new char[BUFFER_SIZE]; //쓸데없는 휘발성 값이니
        char *file2buffer = new char[BUFFER_SIZE];

        do
        {
            a->read(file1buffer, BUFFER_SIZE);
            b->read(file2buffer, BUFFER_SIZE);

            if (memcmp(file1buffer, file2buffer, BUFFER_SIZE) != 0)
            {
                cout << "Files are not equal, at least one of the byte was different" << endl;

                delete [] file1buffer;
                delete [] file2buffer;
                return false;
            }
        }while(a->good() && b->good()); //a->good() means a is good() state, and b->good means iit is good() state

        delete [] file1buffer;
        delete [] file2buffer;
        return true;
    }
    else
    {
        cout << "Size of Files are not equal" << endl;
        return false;
    }
}
int sizeOfFile(fstream * file)
{
    file->seekg(0, ios::end); //check the from begging to end
    int sizeOfFile = file->tellg(); // check the pointor position
    file->seekg(0, ios::beg); // and back the pointer of position as origin
    return sizeOfFile;
}

Extracting Characters from files

#include <iostream>
#include <fstream>

using namespace std;

int main()
{
    /*
        getline(where to store the extracted characters, how many characters should be taken unless, separator(delimiter)) - extracts seperators and delete it
        get(where to store the extracted characters, how many characters should be taken unless, separator(delimiter)) - doesn't extract seperator
        ignore(how_many_characters_to_extracte AND TO IGNORE THEM, separator) - extracts characters

        get();
    */

    fstream file;

    file.open("sample.txt", ios::in | ios::binary);

    if (file.is_open())
    {
        char first, second;
        char buffer[50];

        cin >> buffer;
        // cin >> getline(buffer, 50) it can get all the word how many word i write, but just cin >> buffer if there is 'space' it just stop

        cout << buffer << endl;
        do
        {
            file.getline(buffer, 50, ' '); // ' ' <- this is just delimeter , so if we change it to 'a', this function will be reading by a. (예로 나는 사람이다에서 띄어쓰기 부분 ' ' <- 에서 멈춘다)
            // 50 means we get 50 character from first sentence of last word

            second = file.get(); // 그리고 그 띄어씌기 이후의 문자 하나를 받는다.

            file.ignore(40, '\n'); // '\n' means that in there is seperator

            cout << buffer << " " << second << ". " << endl;

        } while(!file.eof());


    }
    else
        cout << "The file couldn't be opened properly" << endl;

    return 0;
}

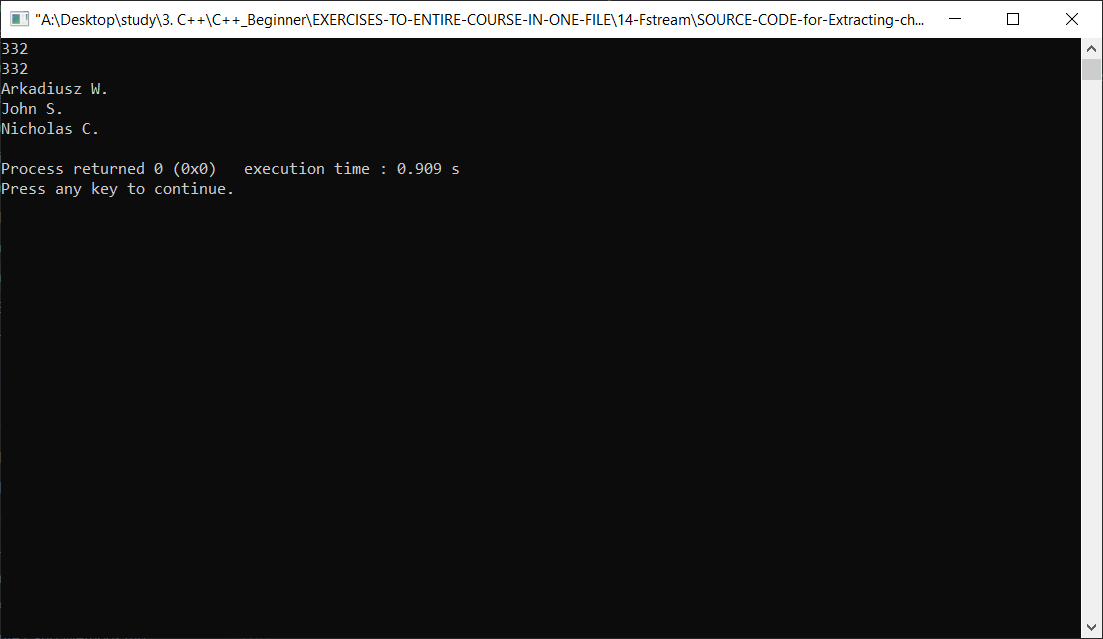
result

Gcount Counting Characters from last operation

#include <iostream>
#include <fstream>

using namespace std;

int main()
{
    /*
        gcount - Getcharacter Count - get count of extracted characters from last extraction operation
    */

    fstream file;

    file.open("sample.txt", ios::in | ios::binary);

    if (file.is_open())
    {
        char buffer[250];
        do
        {
            file.getline(buffer, 250);

            cout << buffer << " " << file.gcount() << endl;
        }while(!file.eof());
    }
    else
        cout << "The file couldn't be opened properly" << endl;

    return 0;
}

result

Comment  Read more

4. UCB1 and Bayesian Method

|

UCB1

  • Another Method to Solve Explore-Exploit ( also from A/B Testing Classes)
  • Idea: confidence bounds
  • Intuitively, we know that sample mean from 10 samples is less accurate than a sample mean from 1000 samples
  • Chefnoff Hoeffiding bound:
  • Looks complicated, but leads to a simple algorithm
  • square(2*ln(N)/N_j) <- “Choose” epsilon equal to this upper bound
  • N = number of times i’ve played in total, N_j = number of times i’ve played bandit j
  • How do we use this formular? Same as optimistic initial values Method
  • just be greedy, but with respect to \(\ln{X}_{UCB-J}\)
  • Key: ratio Between ln(N) and $N_j$
  • if only $N_j$ is small, then upper bound is high
  • if $N_j$ is large, upper bound is small
  • ln(N) grow more slowly than N, so eventually all upper bounds will shrink
  • by then we’ve collected lots of data, so it’s ok
  • so we converge to purely greedy strategy
  • ε-greedy는 추측값이나 불확실성과랑 관계없이 무조건 랜덤하게 실행하는 반면에 어떤 액션을 했을 때, 그 액션은 많이 해봤으니 어느정도 불확실할 것이라는 전재로 불확실성을 고려하여 액션을 취한다.)
  • 즉 시간이 지날 수록 ln(N)의 값은 작아지는데, 많은 샘플들이 쌓이면 0으로 수렴함으로 결곡 적은 샘플을 가지고 있을때 취하는 액션들을 보정해준다고 보면 된다.

Code

import numpy as np
import matplotlib.pyplot as plt
from Comparing_epsilons import run_experiment as run_experiment_eps

class bandit:
    """docstring for ."""

    def __init__(self, m, upper_limit = 0):
        self.m = m
        self.mean = upper_limit
        #the mean instance variable is our estimate of the bandit's mean
        self.N = 1

    def pull(self):
        return np.random.randn() + self.m
    # the pull function which is simulates pulling the bandit's arm
    # every bandit's reward will be a gassium with unit variant


    def update(self, x):
        self.N +=1
        self.mean = (1 - 1.0/self.N)*self.mean + 1.0/self.N*x

    #Finally, we have the update function which takes an X, which is the latest sample recieved from the bandit
def ucb(mean, n, nj):
    if nj == 0:
        return float('inf') #infinity

    return mean + np.sqrt(2*np.log(n) / nj)

def run_experiment(m1, m2, m3, N):
    bandits = [bandit(m1), bandit(m2), bandit(m3)]

    data = np.empty(N)
    for i in range(N):
        j = np.argmax([ucb(b.mean, i+1, b.N) for b in bandits])
        x = bandits[j].pull()
        bandits[j].update(x)
        # for the plot
        data[i] = x
    cumulative_average = np.cumsum(data) / (np.arange(N) + 1)

  # for b in bandits:
  #   print("bandit nj:", b.N)

  # plot moving average ctr
    plt.plot(cumulative_average)
    plt.plot(np.ones(N)*m1)
    plt.plot(np.ones(N)*m2)
    plt.plot(np.ones(N)*m3)
    plt.xscale('log')
    plt.show()

  # for b in bandits:
  #   print(b.mean)
    return cumulative_average
if __name__ == '__main__':
    c_1 = run_experiment_eps(1.0, 2.0, 3.0, 0.1, 100000)
    ucb = run_experiment(1.0, 2.0, 3.0, 100000)

    # log scale plot
    plt.plot(c_1, label='eps = 0.1')
    plt.plot(ucb, label='ucb1')
    plt.legend()
    plt.xscale('log')
    plt.show()

    # linear plot
    plt.plot(c_1, label='eps = 0.1')
    plt.plot(ucb, label='ucb1')
    plt.legend()
    plt.show()

Bayesian Method

  • thompson sampling(각 보상(reward) 분포의 파라미터 확률 변수를 보고 이 파라미터의 분포로 부터 무작위로 추출하여 해당 값에 대한 Reward 기대값이 가장 높은 기계를 선택한다. 그리고 나서 Bayesian 정리를 이용하여 기계에 대한 파라미터 분포를 업데이트 한다. Iteration을 하여 점점 높아지는 보상의 평균의 기계를 선택하게 된다.)
  • Let’s think about confidence intervals again
  • we know Intuitively that sample mean from 10 samples is less accurate than sample mean from 1000 samples
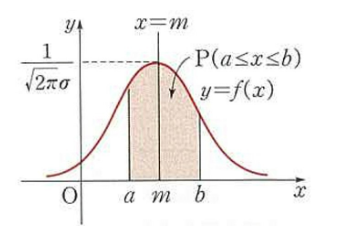
  • Central Limit Theorem says that sample mean is approximately Gaussian
  • Any Function of RVs is a RV(random Variable)
  • Bayesian paradigm takes this a step further
  • what if μ is Also a RV?
  • Data is fixed; parameters are random
  • we want to find the distribution of the parameter(入数) given the data
  • should be more accurate than if did not have the data
  • we call this the Posterior
  • Flip the Posterior to find it in terms of likelihood and prior
  • Likelihood(연속 사건에서는 구간에 대한 추정은 가능하지만(PDF(Probability Density Function)), 특정사건에 대한 추정이 불가능할때 PDF에서 y값을 이용해서 P값을 구하겠다라는 것이다. 즉 0~100까지 있는 변수중에서 30을 뽑을 확률은 0이지만 likelihood로 보았을때에는 0.4인 것이다. 즉 세번 연속으로 뽑았을떄 2,49,20 이 나올 확룔은 0 X 0 X 0으로 0이지만, Likelihood에서는 0.4 x 0.2 x 0.01 = 0.008 이다.
  • Disadvantage of Bayesian method: we must choose the prior
    • Non-negligible effect on Posterior
  • Problem: Integral is usually intractable(很难处理的), we need “tricks” to solve this(만약 Bayesian으로 Posterior를 계산한다고 할 때, 각 항목이 일반적인 분포를 따르지 않늗다고 한다면(즉 들쑥 날쑥) 도출하는 방식이 매우 어렵기 때문에 Trick이 필요. 예로 입술에 빨간색이 뭍었을때 김치를 먹었는지 고추장을 먹었는지 예측할 수 있는 것이다.)
  • special(likelihood,prior) pairs where we can easily solve this
  • called conjugate priors(Likelihood가 특정 분포를 따른다고 할 때, Prior와 Posterior가 동일한 분포면 계산이 빨라진다.)
  • Click-Through rate are like coin tosses; likelihood is bernoulli
  • look up on wikipedia: what is conjugate prior for bernoulli likelihood? Beta (Posterior가 Likelihood의 특정분포를 따른다.)
  • make sense; beta is in [0,1]
  • Likelihood:
  • Prior:
  • combine likelihood and prior to solve for posterior:
  • B(a,b) can be dropped (abosrbed into Normalization constant)
  • Key: posterior takes the form of a beta distribution
  • New a,b : a’ = a + #1’s , b’ = b + #0’s

  • script from A/B testing class: demonstrate to ourself how posterior is updated as we collect clicks/impressions(or heads/tails)
  • we start with the priors $a_0$=1, $b_0$=0 (uniform distribution)
# From the course: Bayesin Machine Learning in Python: A/B Testing
# https://deeplearningcourses.com/c/bayesian-machine-learning-in-python-ab-testing
# https://www.udemy.com/bayesian-machine-learning-in-python-ab-testing
from __future__ import print_function, division
from builtins import range
# Note: you may need to update your version of future
# sudo pip install -U future


import numpy as np
import matplotlib.pyplot as plt
from scipy.stats import beta

def plot(a, b, trial, ctr):
  x = np.linspace(0, 1, 200)
  y = beta.pdf(x, a, b)
  mean = float(a) / (a + b)
  plt.plot(x, y)
  plt.title("Distributions after %s trials, true rate = %.1f, mean = %.2f" % (trial, ctr, mean))
  plt.show()

true_ctr = 0.3
a, b = 0, 1 # beta parameters
show = [0, 5, 10, 25, 50, 100, 200, 300, 500, 700, 1000, 1500]
for t in range(1501):
  coin_toss_result = (np.random.random() < true_ctr)
  if coin_toss_result:
    a += 1
  else:
    b += 1

  if t in show:
    plot(a, b, t+1, true_ctr)
  • Pattern: distribution of CTR gets skinnier/taller as we collect Data
  • Because we’re becoming more confident in that estimate/variance decreases
  • Natural way to represent confidence bounds
  • is an instance of online learning
  • distribution becomes more precise after every coin toss, not just after we collect all the data
  • All the methods we’ll learn later (iterative update)

Application to the bandit Problem

  • the key is sampling
  • instead of upper confident bound like in UCB1, we take the argmax of our samples of each bandits
  • Explore:
    • Not much data; distributions are fat; can sample high values
  • Exploit:
    • Lots of data; distributions are skinny; will only sample near true mean
  • The Bayesian Posterior automatically controls how much exploration/exploitation we do
  • bayesian method(likelihood)를 이용하여 샘플이 많아 질수록 점점 뚜렷하게 잘 찾게 된다.
# From the course: Bayesin Machine Learning in Python: A/B Testing
# https://deeplearningcourses.com/c/bayesian-machine-learning-in-python-ab-testing
# https://www.udemy.com/bayesian-machine-learning-in-python-ab-testing
from __future__ import print_function, division
from builtins import range
# Note: you may need to update your version of future
# sudo pip install -U future


import matplotlib.pyplot as plt
import numpy as np
from scipy.stats import beta


NUM_TRIALS = 2000
BANDIT_PROBABILITIES = [0.2, 0.5, 0.75]


class Bandit(object):
  def __init__(self, p):
    self.p = p
    self.a = 1
    self.b = 1

  def pull(self):
    return np.random.random() < self.p

  def sample(self):
    return np.random.beta(self.a, self.b)

  def update(self, x):
    self.a += x
    self.b += 1 - x


def plot(bandits, trial):
  x = np.linspace(0, 1, 200)
  for b in bandits:
    y = beta.pdf(x, b.a, b.b)
    plt.plot(x, y, label="real p: %.4f" % b.p)
  plt.title("Bandit distributions after %s trials" % trial)
  plt.legend()
  plt.show()


def experiment():
  bandits = [Bandit(p) for p in BANDIT_PROBABILITIES]

  sample_points = [5,10,20,50,100,200,500,1000,1500,1999]
  for i in range(NUM_TRIALS):

    # take a sample from each bandit
    bestb = None
    maxsample = -1
    allsamples = [] # let's collect these just to print for debugging
    for b in bandits:
      sample = b.sample()
      allsamples.append("%.4f" % sample)
      if sample > maxsample:
        maxsample = sample
        bestb = b
    if i in sample_points:
      print("current samples: %s" % allsamples)
      plot(bandits, i)

    # pull the arm for the bandit with the largest sample
    x = bestb.pull()

    # update the distribution for the bandit whose arm we just pulled
    bestb.update(x)


if __name__ == "__main__":
  experiment()

참조) Gaussian Likelihood/Prior

  • data likelihood is Gaussian
  • we try to find μ only (also Gaussian)
  • Work with precisions(inverse variance)
    • Easier
  • we’re looking for the update equations for m and λ
  • Gaussian Posterior:
  • Drop constant (constant wrt(with regard to)mu):
  • collect like terms and ignore more constant:
  • the form we are looking for :
  • but this is what we just found
  • Equate(同等看待)

Reference:

Artificial Intelligence Reinforcement Learning
Advance AI : Deep-Reinforcement Learning

Cutting-Edge Deep-Reinforcement Learning

Comment  Read more

21. Fstream

|

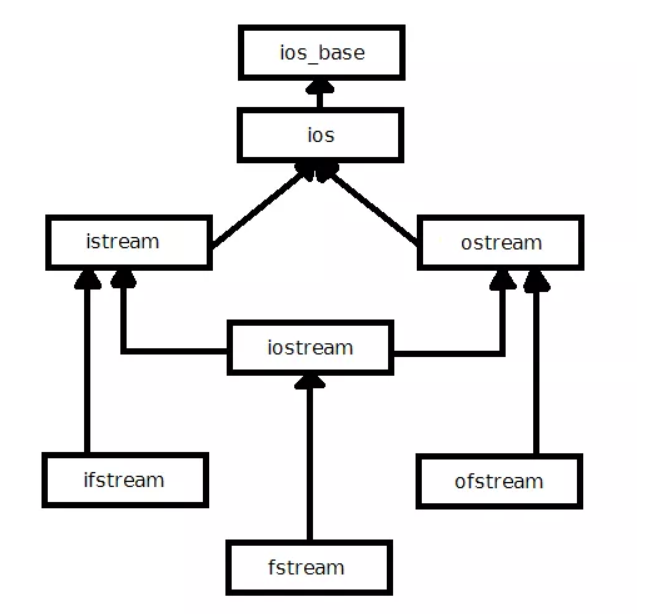
Fstream diagram

File Opening mode

  • Library Fstream

Example 1

Openning_flags.cpp

#include <iostream>
#include <fstream>

using namespace std;

int main()
{
    fstream file;

    file.open("sample.txt", ios::out | ios::app);

    /*
        ios::in - INPUT - READING
        ios::out - OUTPUT - WRITE TO FILE, if there is no file then create it, if there is a file then truncate it (remove content) unless it occurs with ios::in flag
        ios::trunc - TRUNCATE - it is truncating the file (cutting everything inside)(截短)
        ios::ate - At The End - sets pointer at the end of file - the place of pointer can be changed in that mode, it's possible to read and write in that mode
        ios::app - Append - the content is added at the end of file (it's not possible to remove content nor adding something in other place than the end of file)
        ios::binary - opens the file as a binary file. to open image or some thing it is useful

    */

    /*
        DEFAULT MODE (FLAGS)
        fstream - ios::out | ios::in
        ifstream - ios::in
        ofstream - ios::out
    */


    if (file.is_open())
    {
        file << "sample text\n";
        file << "sample text\n"; //those are we can write and it save in the file

    }
    else
        cout << "The file hasn't been opened properly";


    return 0;
}

Example 2

#include <iostream>
#include <fstream>

using namespace std;

int main()
{
    fstream myFileHandler;

    myFileHandler.open("test.txt");

    if (myFileHandler.is_open())
    {
        cout << "The file has been opened properly";

        myFileHandler << "this is a sample text //input contents into txt file

        myFileHandler.close();
    }

    return 0;
}

Example 3

  • ios::rdstate
    • 현재 스트림의 오류 상태 플래그를 리턴한다.
    • 오류 상태 플래그(error state flag)를 얻어온다.
    • 오류 상태 플래그는 입출력 함수를 호출할 때 발생하는 오류에 따라 자동으로 설정되는 플래그이다.
  • Bitwise XOR - ^ (caret) eXclusive OR.
  • Clear(): Flage들을 초기화 한다

예제

/*

test.txt 를 in 형식으로 open 하였으므로 읽기만 가능한다. 따라서 쓰기를 하면
오류가 발생하므로 myfile.fail() 이 true 가 되고 입출력 작업은 중지되지만 오류
상태 플래그를 초기화함으로써 나중에 getline 을 수행할 수 있게 된다.

이 예제는
http://www.cplusplus.com/reference/iostream/ios/clear/
에서 가져왔습니다.

*/
#include <fstream>
#include <iostream>
using namespace std;

int main() {
  char buffer[80];
  fstream myfile;

  myfile.open("test.txt", fstream::in);

  myfile << "test";
  if (myfile.fail()) {
    cout << "Error writing to test.txt\n";
    myfile.clear();
  }

  myfile.getline(buffer, 80);
  cout << buffer << " successfully read from file.\n";

  return 0;
}

결과

Example 4

#include <iostream>
#include <fstream>

using namespace std;

int main()
{
    /*
        tellg - tell get - tell where is the reading pointer
        seekg - seek get - set reading pointer at specified position


        seekg(how_many_bytes_from_the_flag_place, flag);

        possible flags:
        ios::beg - (begin) set from the begin (default)
        ios::end - set from the end
        ios::cur - (current) set from current place
    */

    fstream file;

    file.open("sample.txt", ios::in | ios::binary);

    if (file.is_open())
    {
        string buffer;

        file.seekg(0, ios::end); // this is where the word position from start

        streampos sizeOfFile = file.tellg(); // stream pos, to read

        file.seekg(0); // it is set the zero as begging of pointer so it can read it again from start point, and if
        // we dont use it, it just top the next cout and not execute the reading inside do while function


        cout << "The size of the file is " << sizeOfFile << " bytes" << endl;
        do
        {
            file >> buffer;

            cout << buffer << endl;
        }while (!file.eof());

        if ((file.rdstate() ^ ifstream::eofbit) == 0)
        {
            file.clear();
            cout << file.tellg() << endl; // it results means that binary position that showing last word of pointer position in binary
            file >> buffer;

            cout << buffer << endl;
            //set indicator of place in file to some other place
            // some other operations on file
        }

    }
    else
        cout << "The file couldn't be opened properly" << endl;

    return 0;
}

result

Example 5

#include <iostream>
#include <fstream>

using namespace std;

int main()
{
    /*
        tellp - tell put - tells where is the putting pointer
        seekp - seek put - sets writing (putting) pointer at specified position


        seekp(how_many_bytes_from_the_flag_place, flag);

        possible flags:
        ios::beg - (begin) set from the begin (default)
        ios::end - set from the end
        ios::cur - (current) set from current place
    */

    fstream file;

    file.open("sample.txt", ios::out | ios::binary);

    if (file.is_open())
    {
        string tmp = "this is text about nothing";

        file << tmp;

        cout << file.tellp() << endl;

        file.seekp(0, ios::beg);

        file << "T";
    }
    else
        cout << "The file couldn't be opened properly" << endl;

    return 0;
}

result

Comment  Read more

3. Multi Armed Bandit

|

Multi Armed Bandit

  • First saw in: bayesian Machine Learning(Probability Algorithm): A/B Testing (Ex. go to a Casino; choice between 3 slot machines)
  • Each (for now) gives reward of 0 or 1
  • win rate is unknown(Ex. Could be 0.1 0.3 0.5)
  • Goal: Maximize our winnings
  • Problem: can only discover best bandit by collecting data
  • if we’re psychic, we could just play the bandit with highest win rate
  • Balance explore(collectiong data) + exploit(playing “best-so-far” machines)

1.Traditional A/B Testing

  • Predetermine # of times we need to play/collect data in order to establish statistical significance
  • . # of times needed is dependent on numerous things like the difference between win rates of each bandit(but if we know that, we wouldn’t be doing this test, weird traditional statistics ideas)
  • important rule: Don’t stop our test early. Even if we set N=1000, but after 500 trials, we discover 90% win-rate vs 10% win rate. we still may not stop
  • Much different from Human behavior
  • suppose we’re playing in a real casino, we get 2/3 on one bandit, 0/3 on the other.
  • we have a strong urge to play the first Bandit
  • we know “ as a data scientist” that 3 is a small sample size
  • as a gambler we do not “feel” that way
  • we look at ways to systematically make explore-exploit trade-off(explain upcoming next)
  • better than these 2 suboptimal solutions: A/B testing, human emotion

2. Applications of Explore-Exploit

  • Already discussed in bayesian Machine Learning
    • if you don’t know let’s check it here
  • Lots of scary math! How does it apply in the “real world”?
  • the casino example seems contrived(预谋的)
  • The explore-exploit dilemma(and the subsequent Algorithm which are intended to “solve” it) are one of the most, if not the most “real world” concepts in Machine Learning
  • Almost every business and online entrepreneur can make use of them

3. Comparing things

  • Quantitatively comparing things applies to almost any business(E.g. we are samsung, selling note8)
  • we have 2 ads we really Like
  • which one is better? the one more likely to lead the user to purchase the phone(naturally)
  • Can measure the click-through rate(CTR) of each ad ( E.g. 10 Clicks/1000 impressions = 1 % CTR)
  • How to measure the CTR? Do an Experiment
  • Show the first ad to 1 million users and Show the second ad to 1 million users
  • Calculate the CTRs and compare
  • How do i know 1 million is the correct number?

4. The nature of Probability

  • We would need an infinite number of samples to get an absolutely precise estimate of the CTR
  • as we collect more samples, the confidence interval shrinks
  • therefore, the more samples we collect, the better
  • but, if one advertisement is better, that means the other is worse
  • if i show the suboptimal(未达最佳标准的) ad 1 million times, i’ve wasted 1million impressions to get a suboptimal CTR
  • my desire to show only the best advertisement(hence make more money) is fundamentally at odds with my desire to have an accurate CTR
    • which is needed to know which advertisement is “best” in the first place

5. Who cares?

  • apple is not the only company selling things
  • almost every modern business uses online advertising
  • but we don’t have to be one, we can simply be someone who owns a website
    • Compare viewing time on old design vs new design
    • is “Buy Now” button better at the top or bottom of sales pages?
    • which “price ending” leads to the most conversions? ₩2000 vs ₩1999
  • these are all the same problem numerically
  • Note: Click Through and conversion rate is the same thing to us, just a generic “success rate”

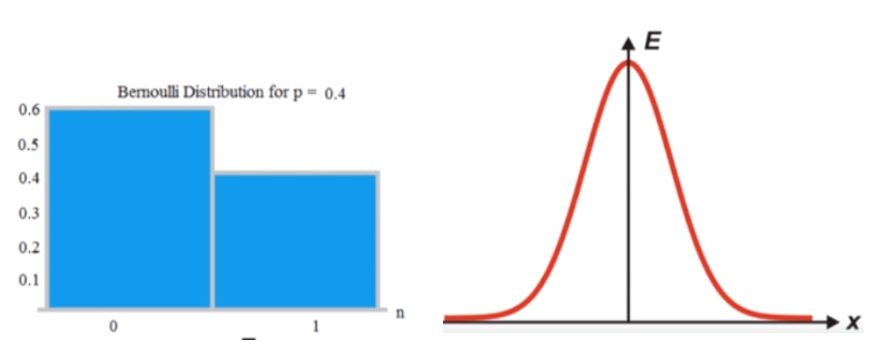
6. Gaussian vs Bernoulli

  • Bernoulli good for measuring success rates
  • Gaussian for Continuous variables

7. Epsilon-Greedy

  • Solution to the explore-exploit dilemma
  • Choose small number ε as Probability of exploration
  • Typical values: 5%, 10%
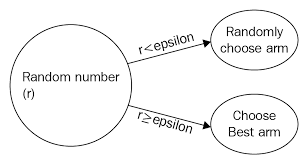
p = random()
if p < eps:
  pull random arm
else:
  pull current-best  arm
  • Eventually, we’ll discover which arm is the true best, since this allows us to update every arm’s estimate
  • in the long run, allows us to explore each arm an infinite number of times
  • Problem: we get to a point where we explore when we don’t need to
  • For epsilon = 10%, we’ll continue to spend 10% of the time doing suboptimal things
  • Could do A/B test at some Predetermined time, then set epsilon=0
  • But we’ll learn better ways to adapt

8. Estimating Bandit Rewards

  • Assuming bandit rewards are not just coin tosses.
  • The best way to keep track of reward is General Method “Mean”
  • Works for $ 1/0 $ too

[P(k=1) = (#of1’s)/(#of1’s+#of0’s) = (#of1’s)/N]

  • P is Probability
  • Need to keep Track of All X
  • Can we be more efficient? YES!
  • New mean can be calculated from old mean like that
  • this “form” is very important to Reinforcement Learning

9. Let’s Recap how do this in supervised learning(Naive Bayes, Decision Trees, Neural Networks)

class Mymodel:
  def fit(x,y):
    # our job
  def Predict(x):
    # our job
  • For example boilerplate
Xtrain, Ytrain, Xtest, Ytest  = get_data() # 1. Get data
model = Mymodel() # 2. Instantiate Model
model.fit(Xtrain,Ytrain)
model.socre(Xtest,Ytest)

10. Designing our bandit Program

  • Since this is not Supervised learning, there is still a pattern to be followed
  • Reminder: A “casino Machine” is just an analogy for real-life applications
    • Serving advertisements you hope users will click on
    • Testing different website design to see which keeps our users engaged longest
class MyAwesomeCasinoMachine:
  def pull():
    # simulates drawing from the true distribution
    # which we wouldnt know in "real life"
for t in range(max_iterations):
  # pick casino machine to play based on Algorithm
  # update Algorithm parameters
# plot useful info (ave reward, best machine, etc)
import numpy as np
import matplotlib.pyplot as plt

class bandit:
    """docstring for ."""

    def __init__(self, m):
        self.m = m
        self.mean = 0
        #the mean instance variable is our estimate of the bandit's mean
        self.N =0

    def pull(self):
        return np.random.randn() + self.m
    # the pull function which is simulates pulling the bandit's arm
    # every bandit's reward will be a gassium with unit variant


    def update(self, x):
        self.N +=1
        self.mean = (1 - 1.0/self.N)*self.mean + 1.0/self.N*x
    #Finally, we have the update function which takes an X, which is the latest sample recieved from the bandit
def run_experiment(m1,m2,m3,eps,N):
    # we are going to compare three different bandits
    bandits = [bandit(m1), bandit(m2),bandit(m3)]
    # Three difference means

    data = np.empty(N)

    for i in range(N):
        # epsilon greedy
        p = np.random.random()
        if p < eps:
            j = np.random.choice(3)
            # we choose a bandit at random
        else:
            j = np.argmax([b.mean for b in bandits])
            # we choose the bandit with the best current sample mean
        x=bandits[j].pull()
        bandits[j].update(x)
        # for the plot
        data[i] = x
    cumulative_average = np.cumsum(data) / (np.arange(N)+1)
    # cumulative_ averager after avery play

    #plt.plot(cumulative_average)
    plt.plot(cumulative_average)
    plt.plot(np.ones(N)*m1)
    plt.plot(np.ones(N)*m2)
    plt.plot(np.ones(N)*m3)
    plt.xscale('log')
    plt.show()

    for b in bandits:
        print (b.mean)

    return cumulative_average

if __name__ == '__main__':
    c_1 = run_experiment(1.0, 2.0, 3.0, 0.1, 100000)
    c_05 = run_experiment(1.0, 2.0, 3.0, 0.05, 100000)
    c_01 = run_experiment(1.0, 2.0, 3.0, 0.01, 100000)

    # log sacle plot
    plt.plot(c_1, label='eps = 0.1')
    plt.plot(c_05, label='eps = 0.05')
    plt.plot(c_01, label='eps = 0.01')
    plt.legend()
    plt.xscale('log')
    plt.show()

    # linear plot
    plt.plot(c_1, label='eps = 0.1')
    plt.plot(c_05, label='eps = 0.05')
    plt.plot(c_01, label='eps = 0.01')
    plt.legend()
    plt.show()    

11.Optimistic Initial Values

  • Another Simple way of solving the explore-exploit dilemma
  • Suppose we know the true mean of each bandit is « 10
  • pick a high ceiling as the initial mean estimate
  • before we set initial mean to “0”, but this time we set initial value to “10”
  • initial sample mean is “too good to be true “
  • All collected data will cause it to go down
  • if the true mean is 1, the sample mean will still approach 1 as I collect more samples
  • All means will eventually settle into their true values(exploitation)
  • Helps exploration as well
  • if we haven’t explored a bandit, its mean will remain high, causing us to explore it more
  • in the main loop: greedy strategy only
  • but using optimistic means
  • it make more looks like optimistic than “Mean”

Code

import numpy as np
import matplotlib.pyplot as plt
from Comparing_epsilons import run_experiment as run_experiment_eps

class bandit:
    """docstring for ."""

    def __init__(self, m, upper_limit = 10):
        self.m = m
        self.mean = upper_limit
        #the mean instance variable is our estimate of the bandit's mean
        self.N = 1

    def pull(self):
        return np.random.randn() + self.m
    # the pull function which is simulates pulling the bandit's arm
    # every bandit's reward will be a gassium with unit variant


    def update(self, x):
        self.N +=1
        self.mean = (1 - 1.0/self.N)*self.mean + 1.0/self.N*x

    #Finally, we have the update function which takes an X, which is the latest sample recieved from the bandit
def run_experiment(m1,m2,m3,N):
    # we are going to compare three different bandits
    bandits = [bandit(m1), bandit(m2),bandit(m3)]
    # Three difference means

    data = np.empty(N)

    for i in range(N):
        j = np.argmax([b.mean for b in bandits])
        # we choose the bandit with the best current sample mean
        x=bandits[j].pull()
        bandits[j].update(x)
        # for the plot
        data[i] = x
    cumulative_average = np.cumsum(data) / (np.arange(N)+1)
    # cumulative_ averager after avery play

    #plt.plot(cumulative_average)
    plt.plot(cumulative_average)
    plt.plot(np.ones(N)*m1)
    plt.plot(np.ones(N)*m2)
    plt.plot(np.ones(N)*m3)
    plt.xscale('log')
    plt.show()

    for b in bandits:
        print (b.mean)

    return cumulative_average
if __name__ == '__main__':
    c_1 = run_experiment_eps(1.0, 2.0, 3.0, 0.1, 100000)
    oiv = run_experiment(1.0, 2.0, 3.0, 100000)

    # log scale plot
    plt.plot(c_1, label='eps = 0.1')
    plt.plot(oiv, label='optimistic')
    plt.legend()
    plt.xscale('log')
    plt.show()

    # linear plot
    plt.plot(c_1, label='eps = 0.1')
    plt.plot(oiv, label='optimistic')
    plt.legend()
    plt.show()

Reference:

Artificial Intelligence Reinforcement Learning

Advance AI : Deep-Reinforcement Learning

Cutting-Edge Deep-Reinforcement Learning

Comment  Read more